Reporting: Causal Inference Model for Membership Program Impact
Overview
To help merchants quantify the value of Angle’s store credit and membership programs, we’ve developed a robust causal inference model. This model estimates the true business impact of program participation — isolating what customers would have done otherwise to determine the causal effect of the program. In this documentation, we walk through our approach using a real-world example from a leading client in the apparel and footwear industry, who validated a significant revenue uplift using our model.Industry Case Study Summary
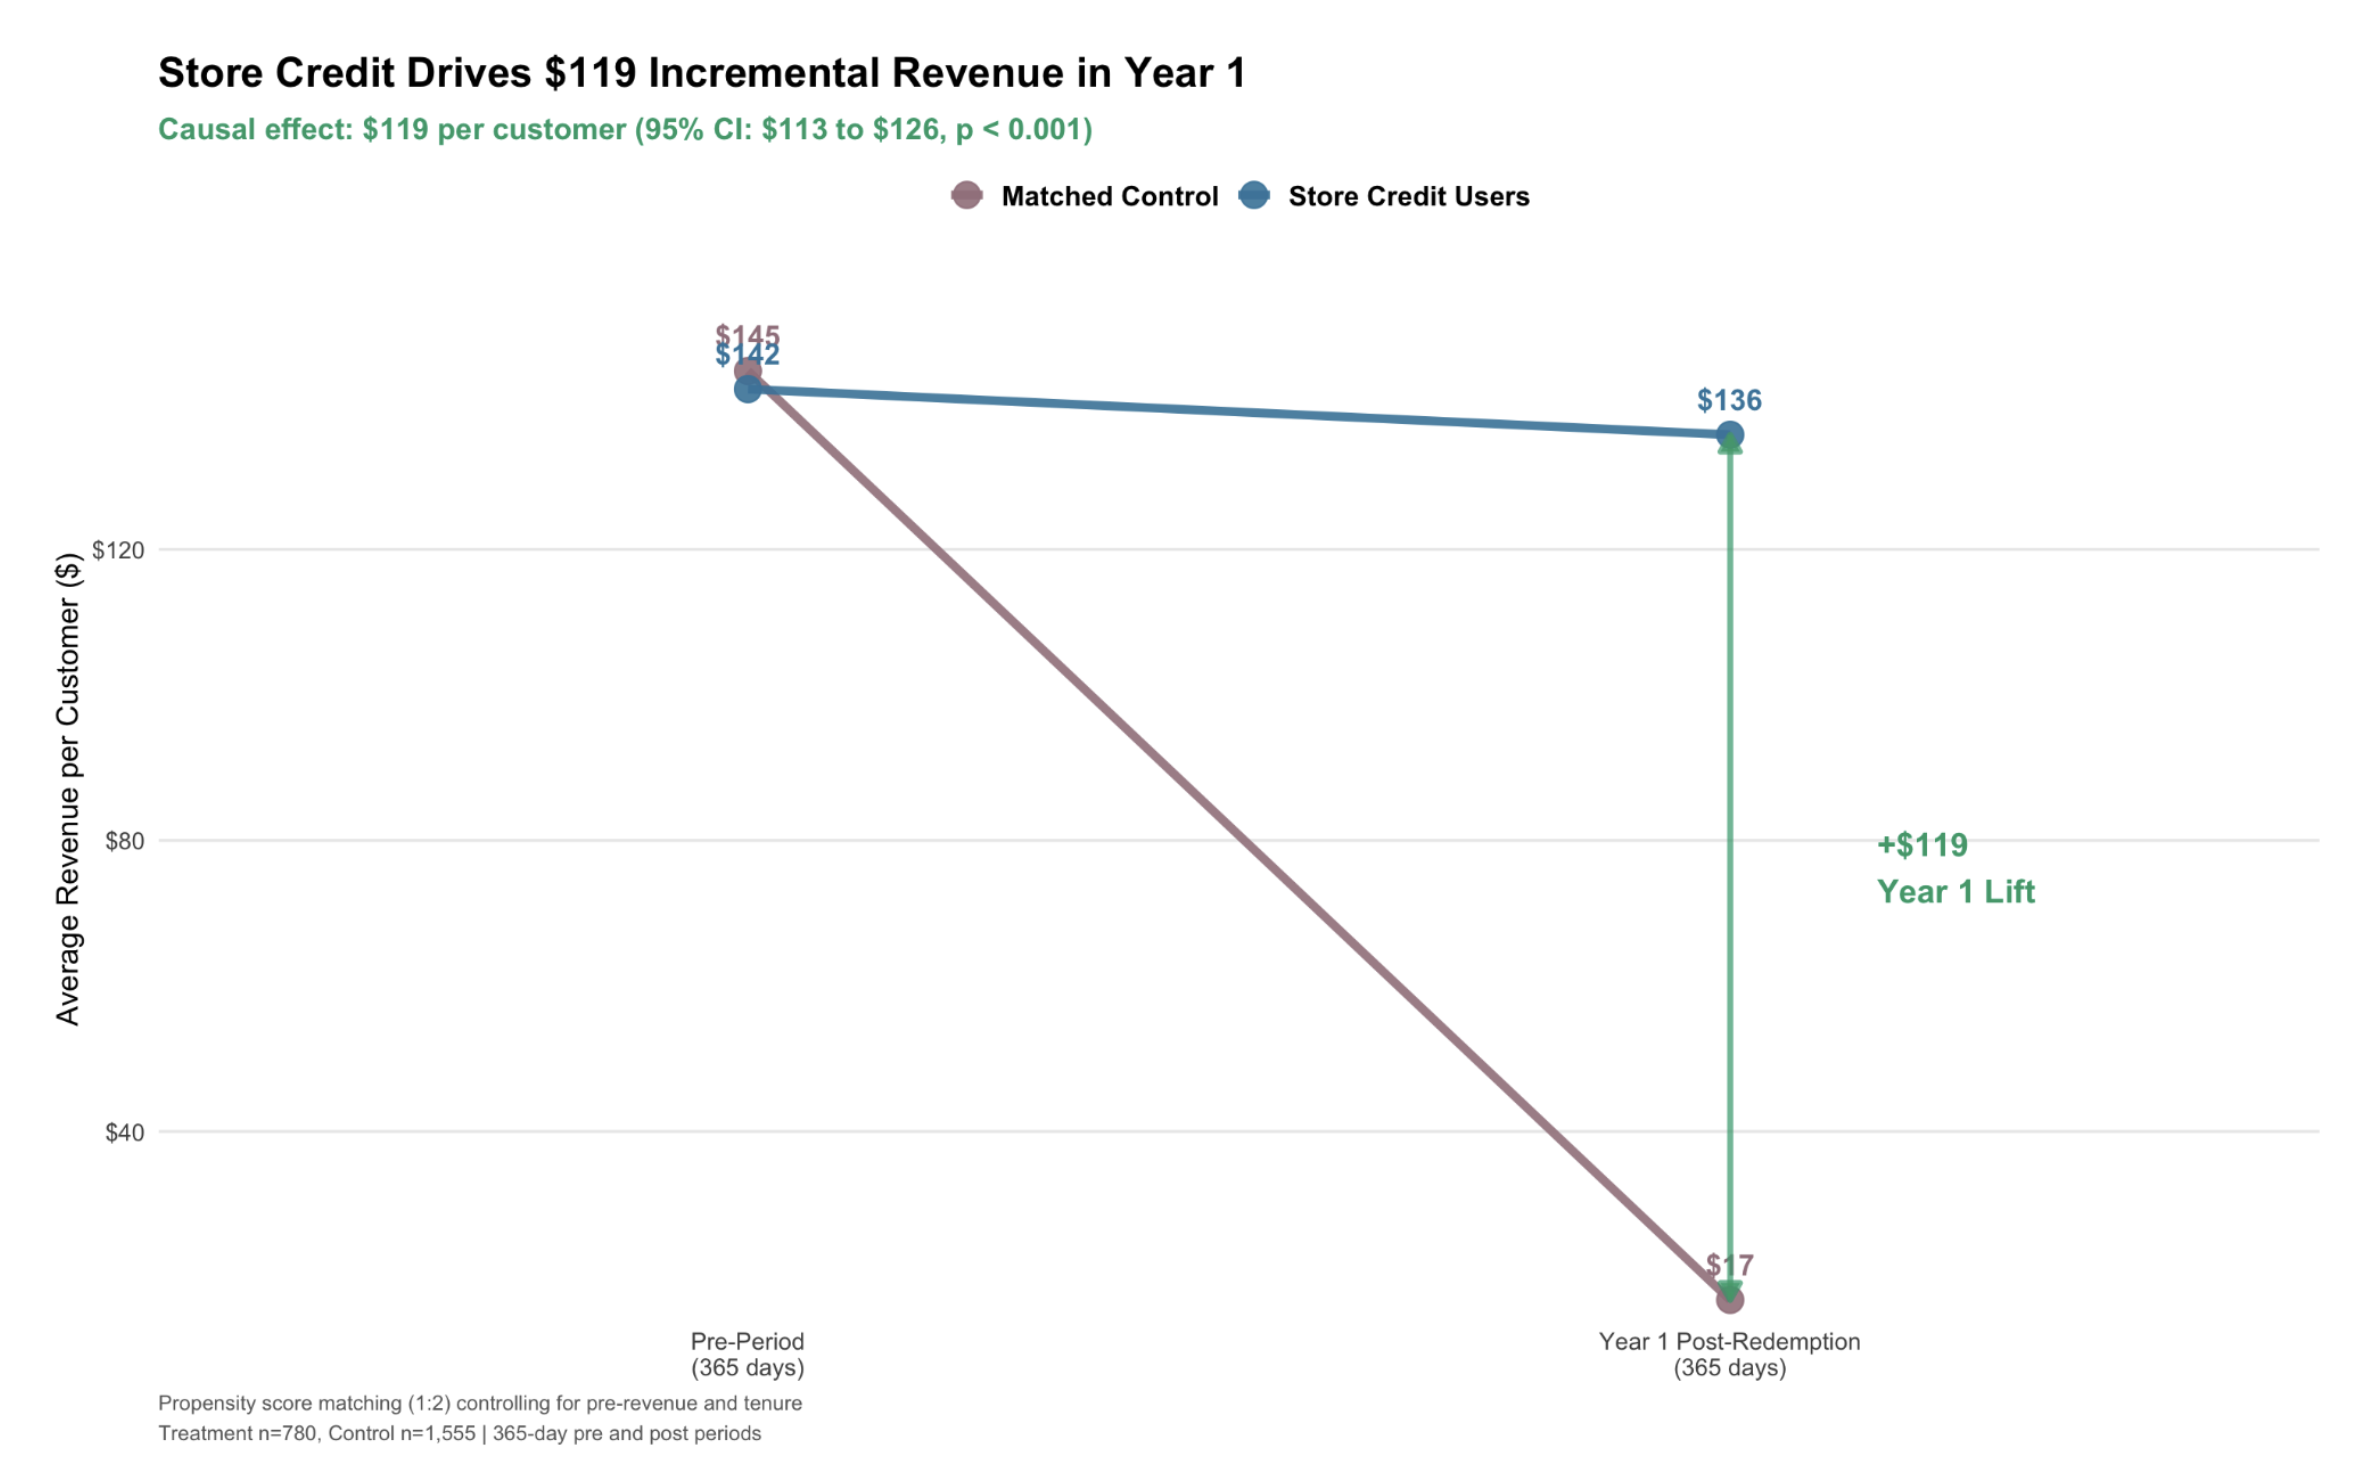
One of our clients in the apparel and footwear sector used Angle’s store credit program and applied our causal inference methodology to measure performance. The results were definitive: $119 in incremental revenue per customer (95% CI: $113–$126)Based on 4,676 store credit users vs. 7,498 matched control customers.
Validated across three independent methods — Propensity Score Matching, Inverse Probability Weighting, and a Placebo Test.
Why Causal Inference?
Merchants often ask:“Did store credit cause customers to spend more, or would they have spent that amount anyway?”This is a causal question, and traditional analytics like A/B tests or simple comparisons often fall short. Our model uses statistical inference to isolate the true impact of the program — correcting for biases like seasonality, customer tenure, or pre-existing behavior.
Step-by-Step: How the Model Works
1. Define Treatment and Control Groups
- Treatment group: Customers who redeemed store credit.
- Control group: Customers who did not redeem credit, matched using pre-treatment behavior.
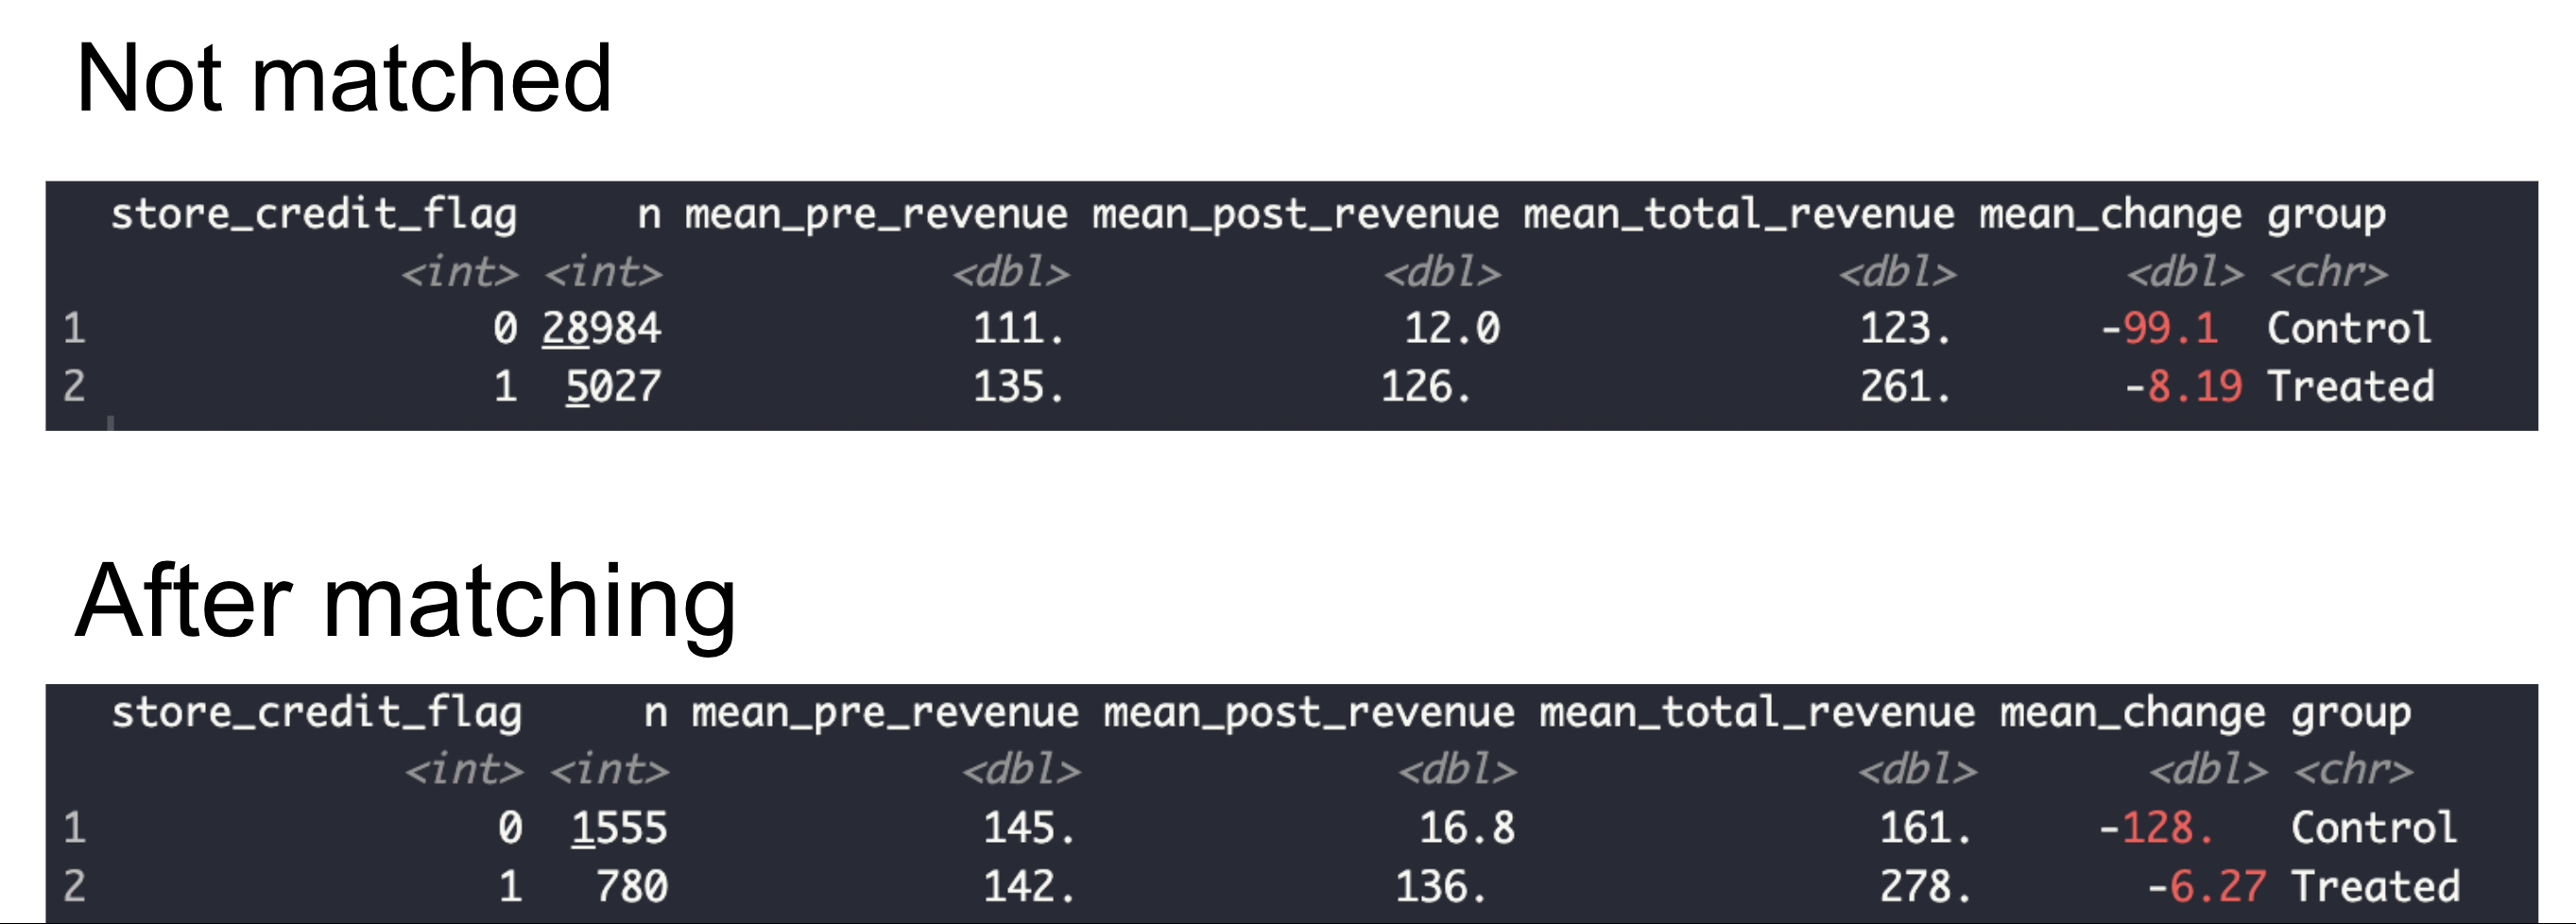
2. Apply Propensity Score Matching
Customers are matched based on pre-program covariates like:- Total revenue
- Purchase frequency
- Tenure with the brand
3. Estimate Causal Effect
After matching, we measure the Average Treatment Effect on the Treated (ATT) — i.e., how much more the treated customers spent because of the program. For this sample client:- Treated post-period revenue: $136
- Control post-period revenue: $16.8
- Estimated causal effect: ~$119
4. Validate with IPW and Placebo Tests
Inverse Probability Weighting (IPW)
We reweight the control group to match the distribution of the treated group using inverse probability scores.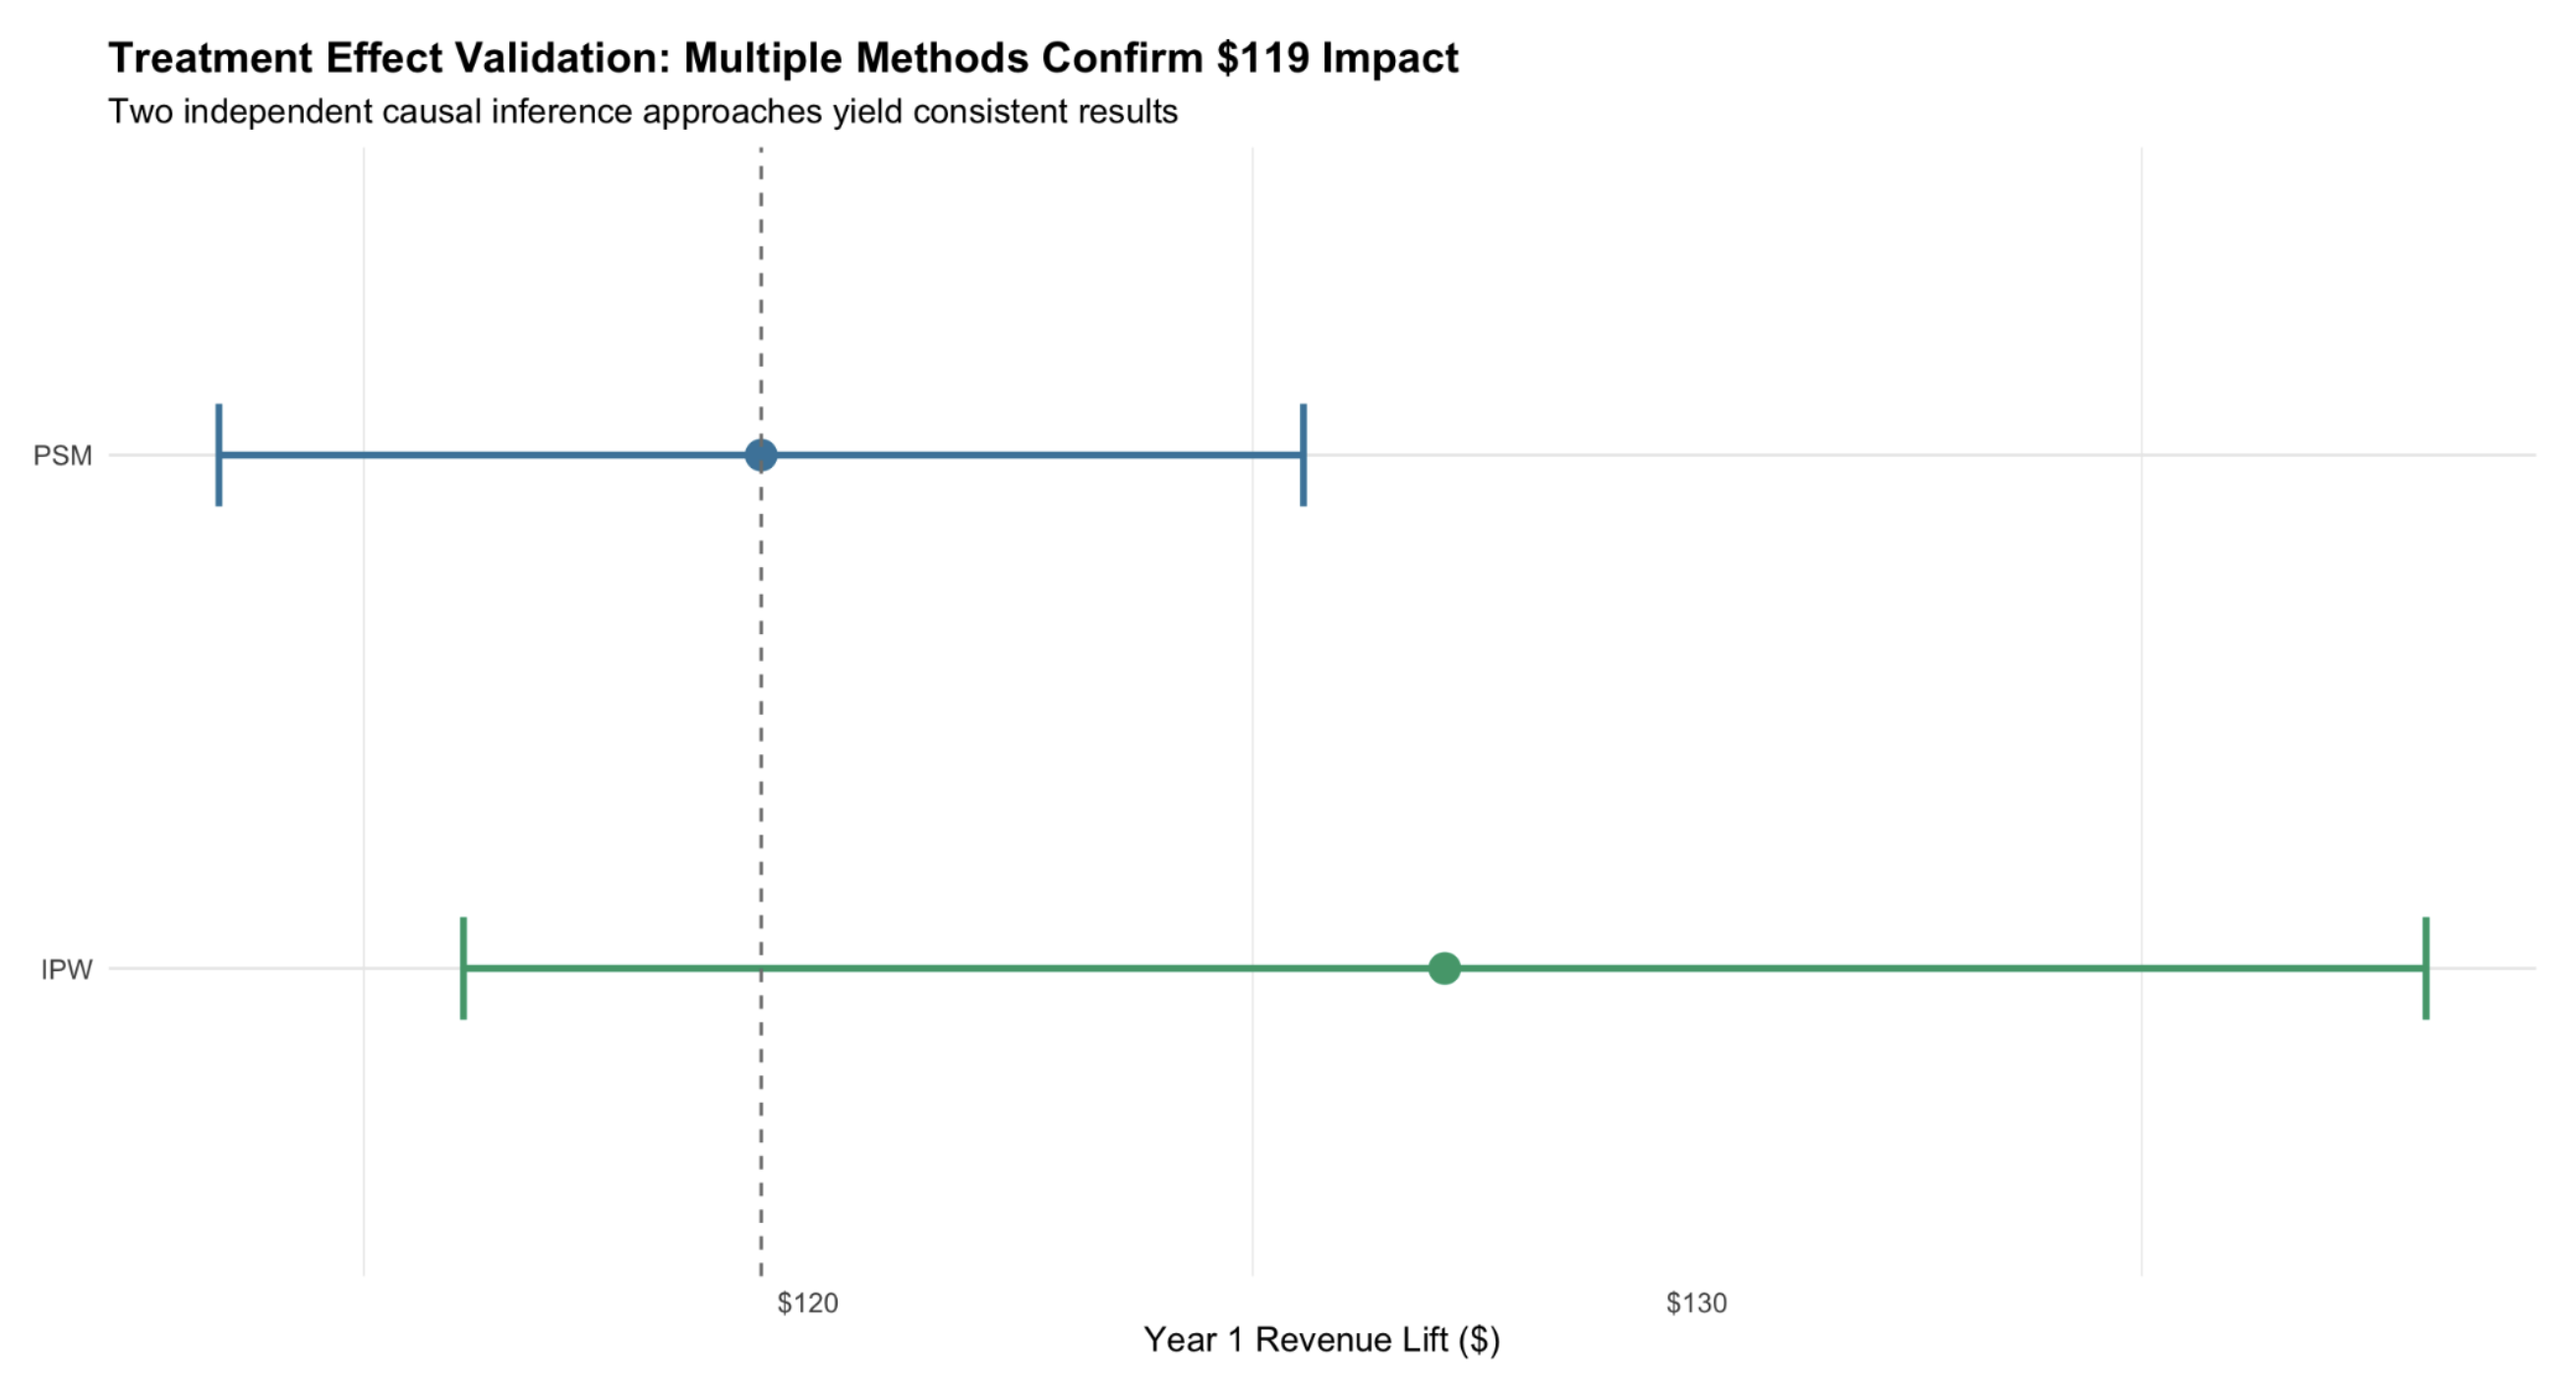
Placebo Testing
We simulate a treatment before the store credit was issued — if any effect is detected, it would indicate bias. No uplift was observed, confirming correct model specification.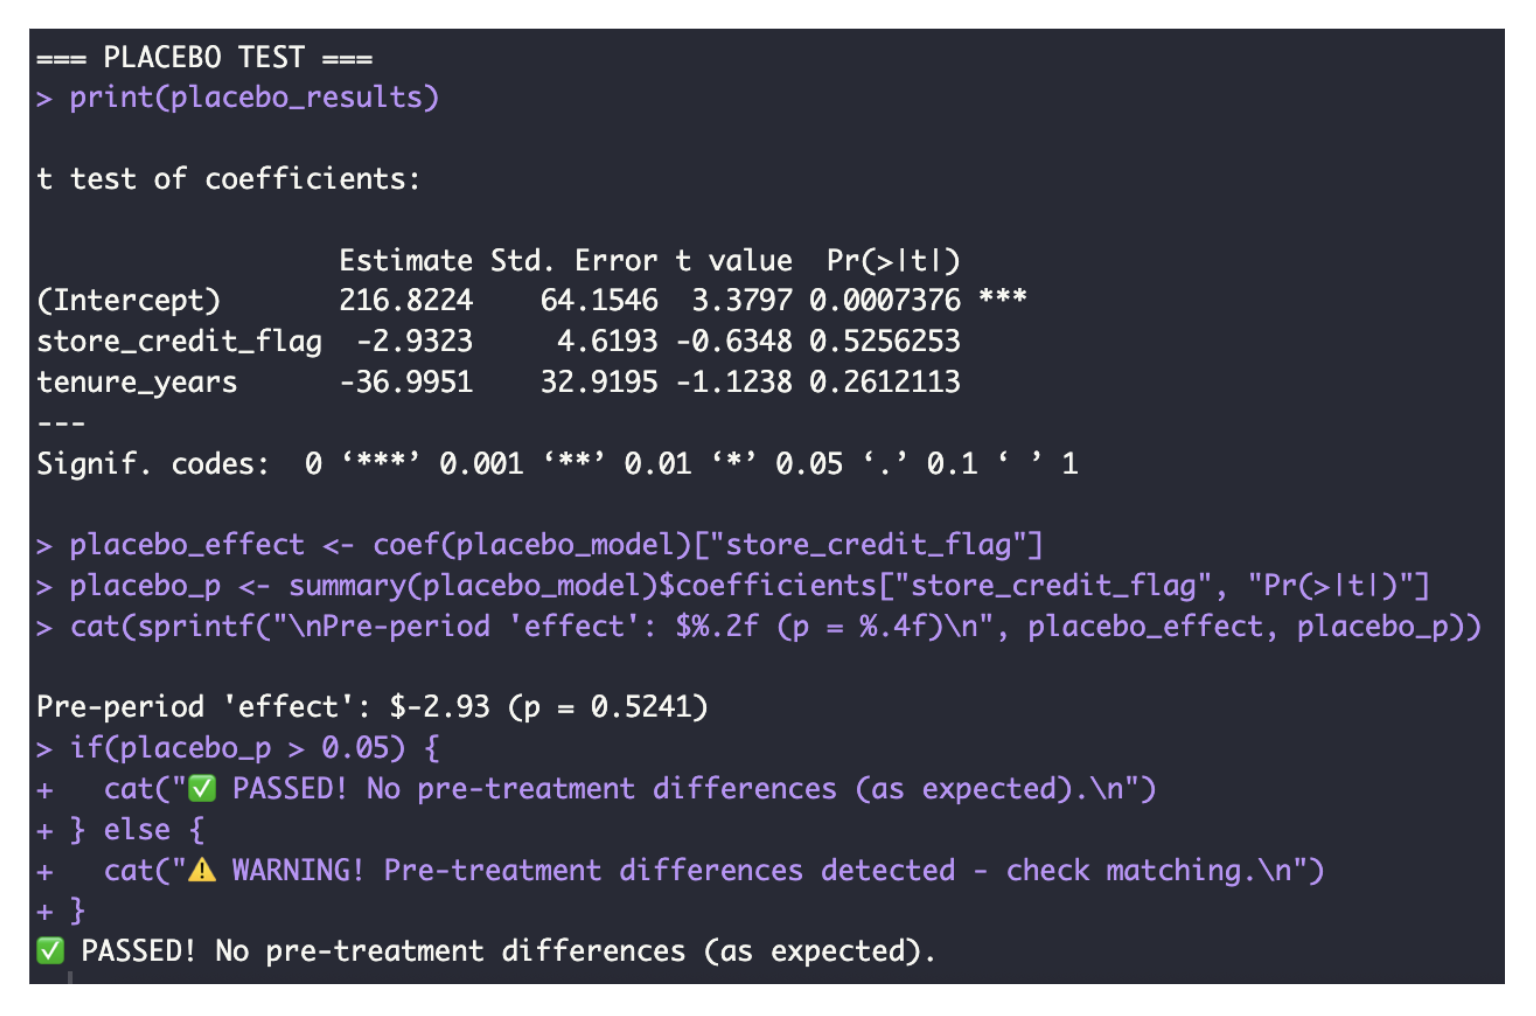
Results and Interpretation
- Incremental Revenue: $119 per customer
- Effect Size: 82% revenue lift vs. control
- Confidence Level: 95%, p < 0.001
Summary
Angle’s Causal Inference Reporting Model enables merchants to:- Quantify true program impact, not just correlation
- Validate ROI using statistically sound methods
- Support decisions with rigorous, peer-reviewed methodologies